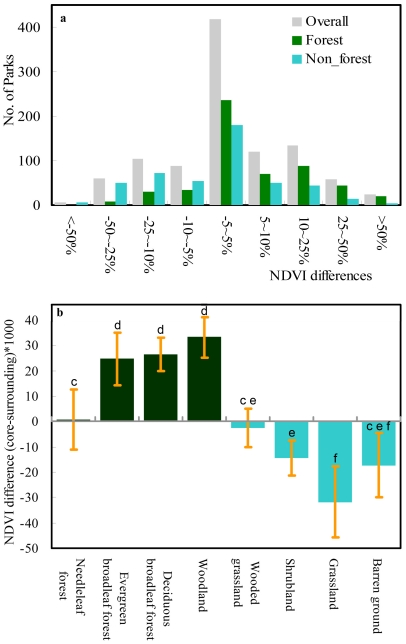
Figure 2. The time-averaged σNDVI (difference of NDVI between core of protected areas and their surroundings).
(a) The number of protected areas with different levels of difference and (b) the difference for protected areas with different land cover types (bars indicate standard deviation). Green for forested, and cyan for non- forested protected areas. Different letters in (b) denote significant differences in σNDVI among land cover types.

