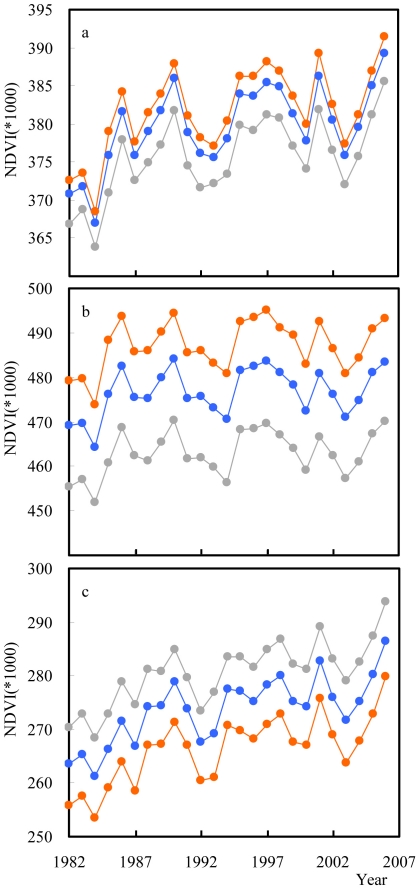
Figure 4. Temporal trends in the mean NDVI of the core of protected areas, their boundary and surroundings.
(a) all protected areas for the core (orange; slope = 0.453×10⁻³, R2 = 0.36), boundary (blue; slope = 0.451×10⁻³, R2 = 0.38) and surroundings (grey; slope = 0.446×10⁻³, R2 = 0.40); (b) forested protected areas (core area: slope = 0.259×10⁻³, R2 = 0.12; boundary area: slope = 0.271×10⁻³, R2 = 0.14; and surrounding area: slope = 0.264×10⁻³, R2 = 0.14), and (c) non-forested protected areas (core area: slope = 0.652×10⁻³, R2 = 0.56; boundary area: slope = 0.633×10⁻³, R2 = 0.57; and surrounding area: slope = 0.637×10⁻³, R2 = 0.60).

