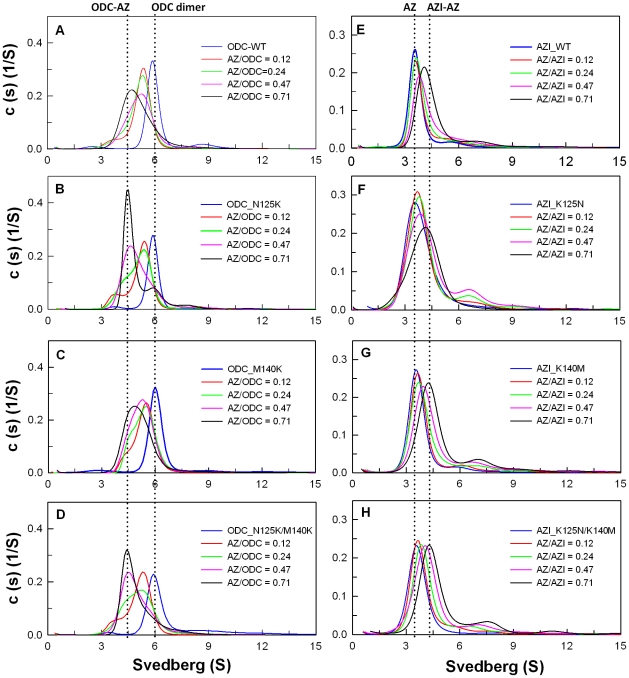
Figure 5. Continuous sedimentation coefficient distribution of human ODC and AZI in the presence of AZ.
The concentration of ODC or AZI was fixed at 0.3 mg/mL with four concentrations of AZ at 0.015, 0.03, 0.06, or 0.09 mg/mL (the molar ratios of AZ/ODC were 0.12, 0.24, 0.47 and 0.73). The sedimentation velocity data were globally fitted with SEDPHAT to acquire the K d values of the ODC-AZ and AZI-AZ complexes (Table 2). (A) ODC_WT. (B) ODC_N125K. (C) ODC_M140K. (D) ODC_N125K/M140K. (E) AZI_WT. (F) AZI_K125N. (G) AZI_ K140M. (H) AZI_K125N/K140M.

