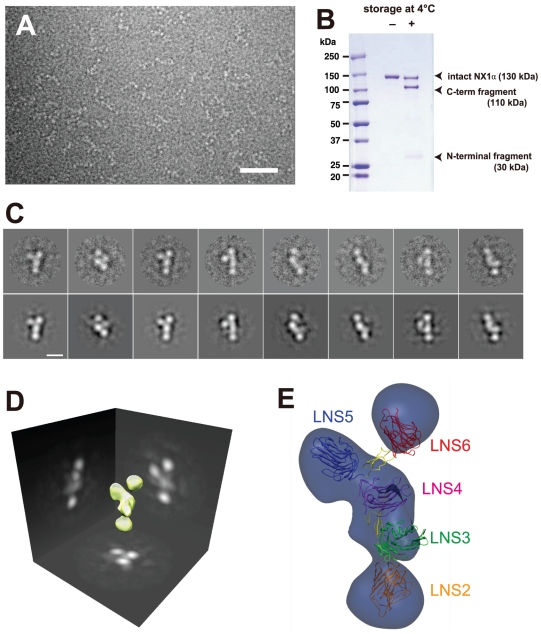
Figure 7. Electron microscopic analysis of the Nrx1α ectodomain (NX1αEC).
(A) A raw image of the negatively stained NX1αEC. Scale bar: 50 nm. (B) Spontaneous degradation of purified NX1αEC. SDS-PAGE analysis of NX1αEC protein immediately after purification (left) and again after 2 months storage at 4°C (right) shows that the protein undergoes proteolytic cleavage to produce N-terminal (30 kDa) and C-terminal (110-kDa) fragments. (C) Two-dimensional class averages (upper row images) obtained from multiple electron micrographs and corresponding projection views produced from the 3-D volume map (lower row images). Scale bar, 10 nm. (D) Three-dimensional reconstruction of the NX1αEC created from multiple oriented particles. (E) Predicted 3D domain organization within the NX1αEC fragment. Atomic coordinates for NX1α(III) are manually fitted to the densities corresponding to the LNS5-6 and LNS3-4 segments, keeping the C-terminus of LNS4 and the N-terminus of LNS5 close enough to be connected. Domain connectivity was also considered when fitting the LNS2 domain structure (PDB ID: 2H0B) into the density at the bottom. LNS1+EGF1 segment disappeared in the reconstructed volume was not assigned.

