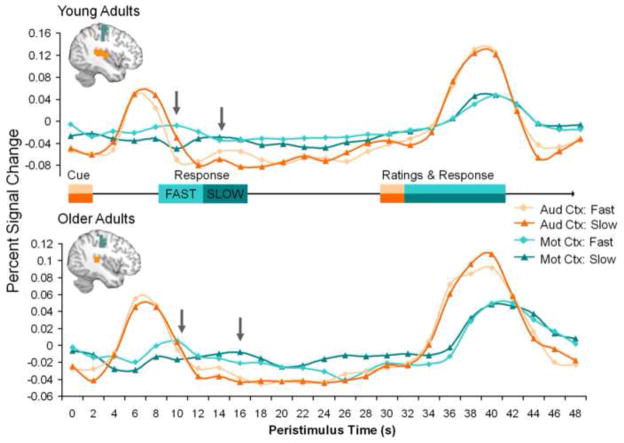
Figure 1.
Time Courses for Fast and Slow Responses. The time courses for fast and slow responses were nearly identical in the auditory cortex (aud ctx, orange/peach lines), and did not differ between age groups. In contrast, the time course for fast and slow responses was very different in the motor cortex (mot ctx, blue lines). The differences in peak latency in the motor cortex (gray arrows) for fast trials (light colors) and slow trials (dark colors) shows similar peaks in each age group, although there was a trend for slower responses in the older adults.

