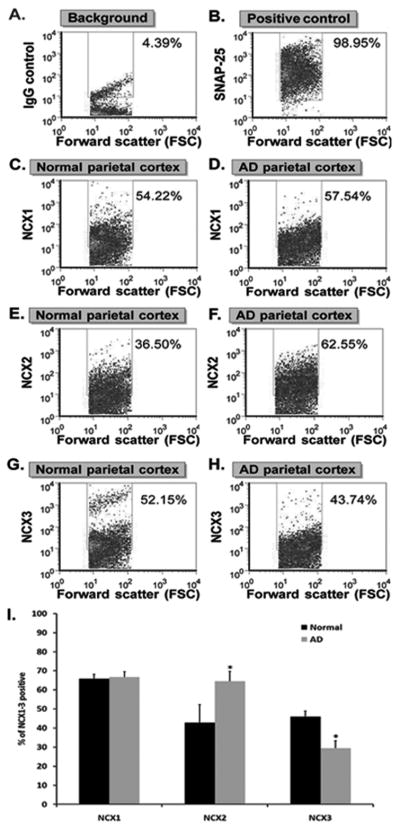
Fig. 4.
Flow cytometry analysis of NCX1, NCX2 and NCX3 in control and AD synaptosomes. Human cortical synaptosomal preparation immunolabeled with (A) non-immune IgG and (B) SNAP-25. Representative density plots of normal (C, E and G) and AD (D, F and H) synaptosomes labeled for NCX1 (C–D), NCX2 (E–F) and NCX3 (G–H). The forward scatter parameter on the X-axis is proportional to size. The positive fraction for NCX1, NCX2 and NCX3 isotypes is shown for control vs. AD parietal cortex (I). Values represent means ± SEM. *P < 0.05, compared to controls.

