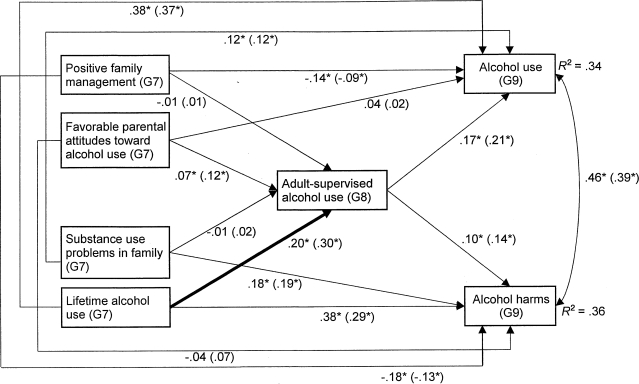
Figure 2.
Standardized coefficients from the unconstrained path models for Washington State and Victoria students. Analysis sample sizes: Washington State: « = 918; Victoria: n = 908. All estimates are standardized. Coefficients for Victoria are in parentheses. The significant between-state difference is indicated by the bold line. G7 = Grade 7; G8 = Grade 8; G9 = Grade 9. *p < .05 or better.

