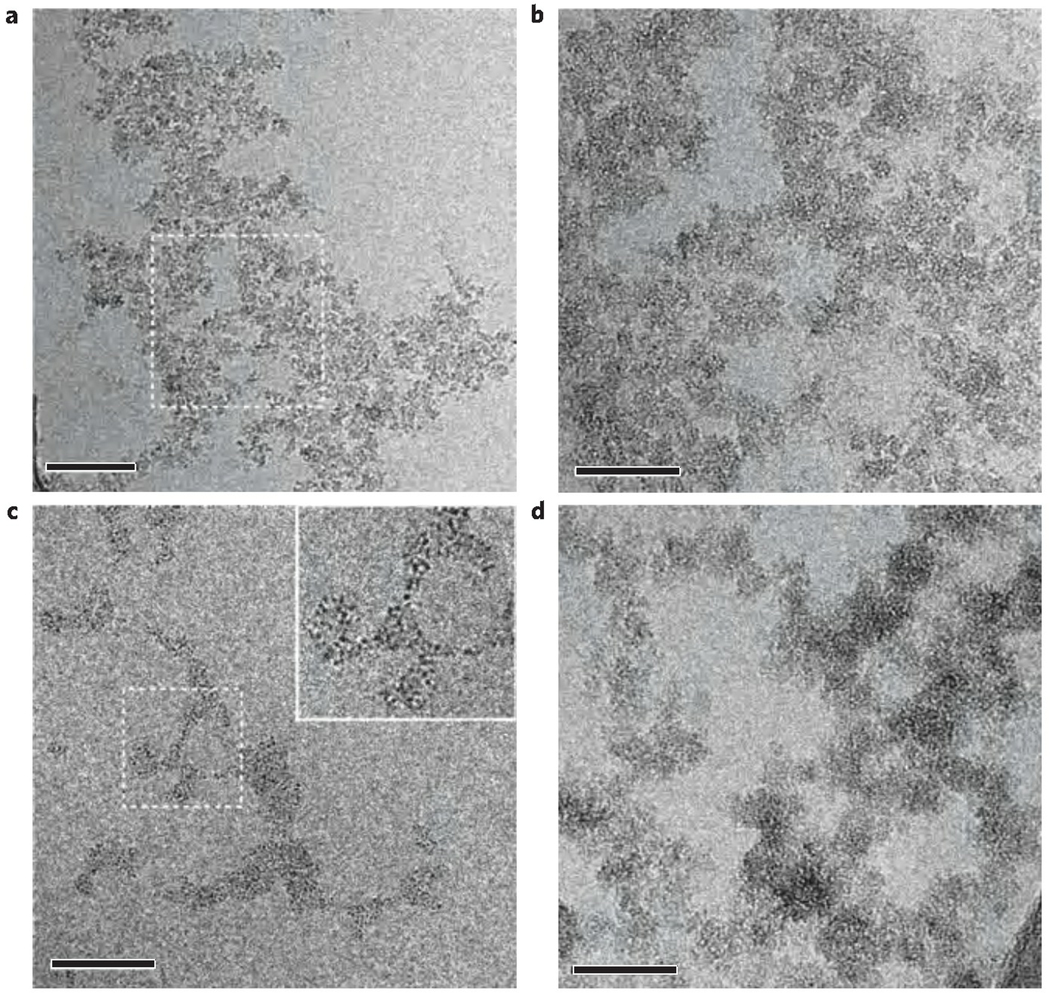
Figure 5. Analysis of calcium phosphate precipitation in the absence and presence of pAsp.
a, CryoTEM image of calcium phosphate aggregates formed after 10 min of reaction without pAsp. Scale bar: 100 nm. b, Higher magnification of the area marked in a. Scale bar: 50 nm. c, CryoTEM image of calcium phosphate aggregates formed after 10 min of reaction in the presence of pAsp. Scale bar: 50 nm. d, CryoTEM image of calcium phosphate aggregates formed after 6 h of reaction in the presence of pAsp. Scale bar: 50 nm.

