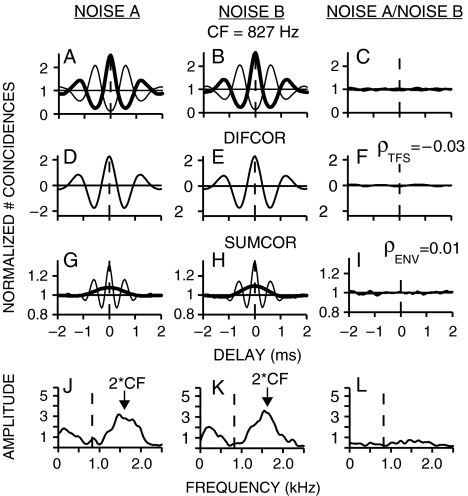
FIG. 1.
Neural cross-correlation coefficients for fine-structure and envelope were computed based on a normalized comparison of within-stimulus (columns 1 and 2) and cross-stimulus (column 3) temporal coding. Spike trains were recorded from a chinchilla AN fiber responding to two uncorrelated broadband noises (A and B). A–B Normalized shuffled autocorrelograms [thick line, e.g., SAC(A+)] and cross-polarity correlograms [thin line, e.g., SCC(A+,A−)]. C Shuffled cross-stimulus correlogram [thick line, e.g., SCC(A+,B+)] and cross-stimulus, cross-polarity correlogram [thin line, e.g., SCC(A+,B−)]. D–F Difcors emphasize fine-structure coding and are computed by subtracting the cross-polarity correlogram from the auto- or cross-stimulus correlogram. ρTFS was computed (Eq. 1) by comparing the peak heights of difcor(AB) to difcor(A) and difcor(B) at a characteristic delay of zero. G–I Sumcors, which emphasize envelope coding, were the average of the cross-polarity and auto- or cross-stimulus correlograms (thin lines). Thick lines represent corrected sumcors that eliminate fine-structure leakage by including only energy at frequencies below CF (see “Methods” section). J–L Envelope power spectral density (PSD; J, K) and cross-spectral density (CSD; L) computed as the Fourier transform of the original sumcors. Leaked fine-structure energy occurs near 2 × CF (arrow); dashed line at CF. ρENV was computed (Eq. 2) from the corrected sumcors by comparing peak heights at a characteristic delay of zero. AN fiber CF = 827 Hz; threshold = 15 dB SPL; Q10 = 1.4; spontaneous rate = 86 spikes/s. Noise spectrum level = 26 dB SPL.

