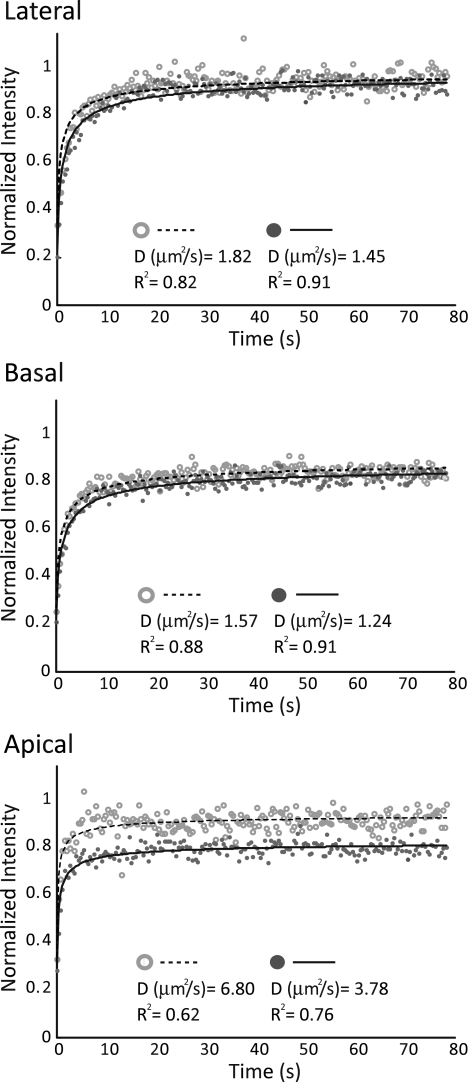
FIG. 2.
Recovery data points and curve fits for six representative cells, two from each OHC plasma membrane region (lateral, basal, and apical). Data points have been background subtracted and normalized. Calculated effective diffusion coefficients, D, as well as goodness of fit parameters, R2, are provided from individual curve fits of each cell. Data from the apical region show more scatter within individual experiments, a higher variability between experiments, and lower R2 values than the lateral and basal membrane curves.

