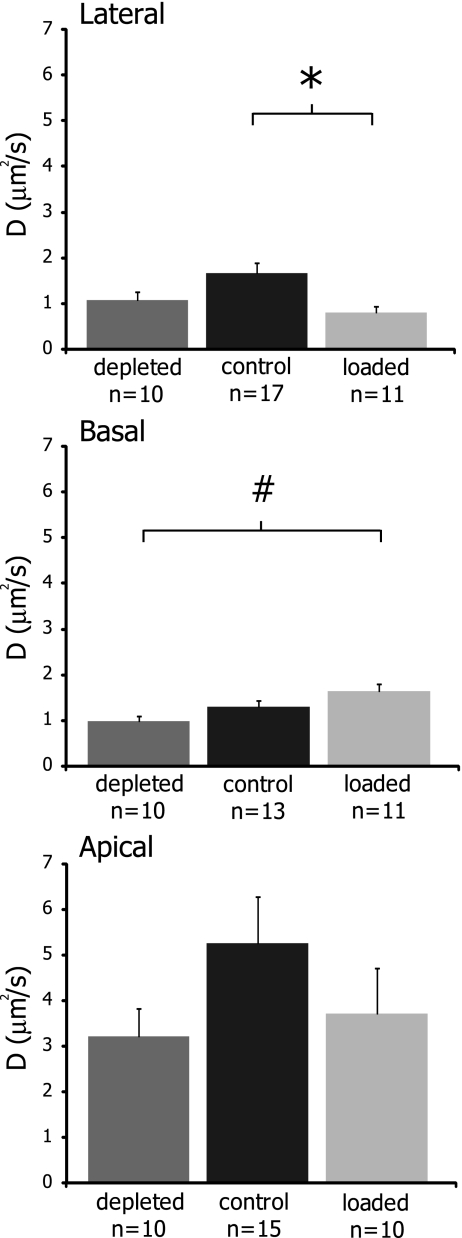
FIG. 4.
Effects of cholesterol manipulations on the effective diffusion coefficients in the OHC lateral, basal, and apical regions. D values were significantly altered from the control value following cholesterol loading in the lateral region (p < 0.01). In the basal region, depletion and loading had significantly different D values (p < 0.01). No statistical differences were detected in the apical region (p > 0.3). Values are plotted as mean ± SEM. Statistical significance from control values is indicated by an asterisk, while significance between loading and depletion is indicated by a number symbol.

