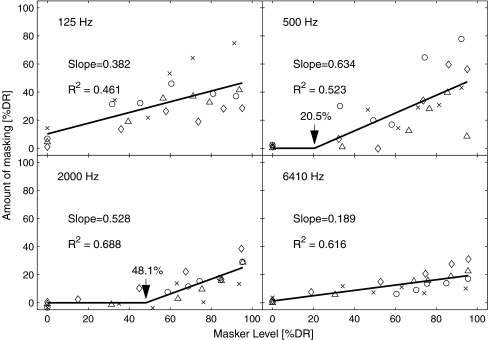
FIG. 9.
GOM functions arranged for each stimulation rate as a function of masker level in percent dynamic range (%DR), collapsing the data across subjects. The function was fit by two lines (a flat line and increasing from a knee point). For each knee point, which was iterated from 0% to 80%, the data were fitted to the lines. The knee point and corresponding slope that produced the least sum of squared residual (SSR) were taken as the parameters for the “best fit” and indicated here. The knee-point fitting was successful in the two rate conditions (500 and 2,000 Hz).

