Figure 1.

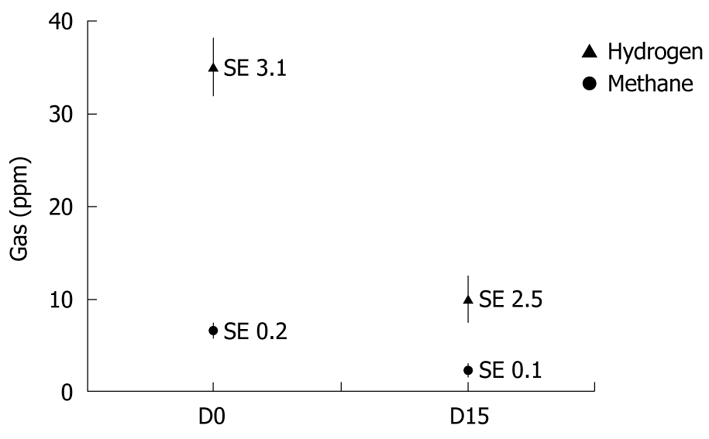
Evolution of breath hydrogen and methane before (D0) and after 15 d (D15) of consumption of low-lactose formula. Values are expressed as mean ± SE. Only the change in expired hydrogen was significant (P < 0.01).

Evolution of breath hydrogen and methane before (D0) and after 15 d (D15) of consumption of low-lactose formula. Values are expressed as mean ± SE. Only the change in expired hydrogen was significant (P < 0.01).