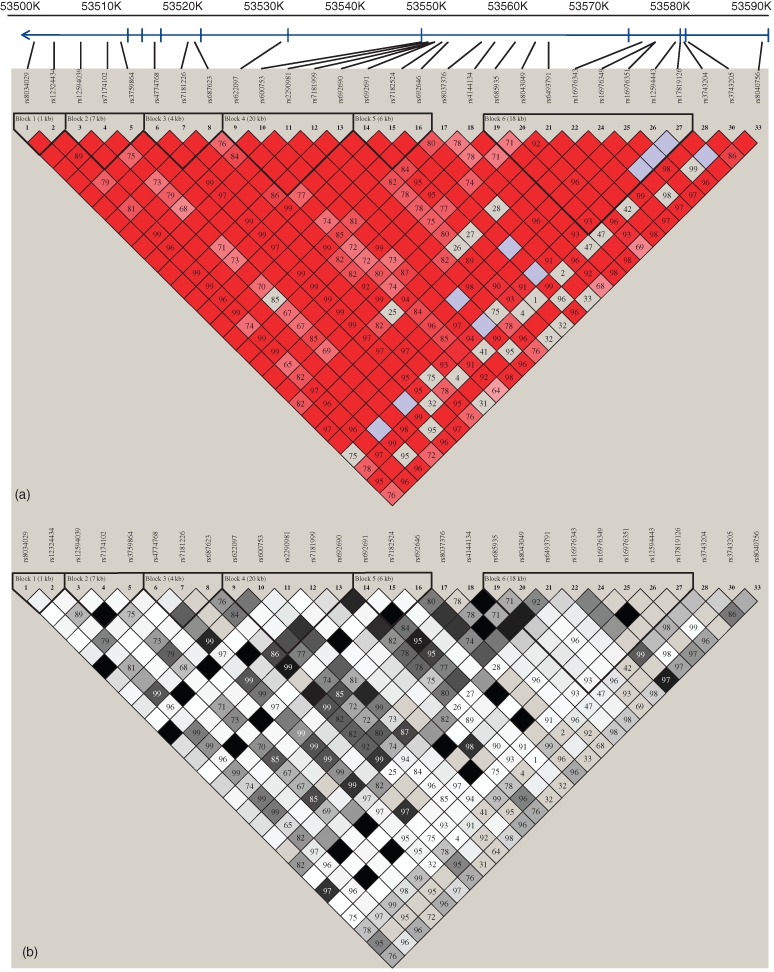
Figure 1. SNPs location and LD across DYX1C1.

The top of the figure shows the structure of the DYX1C1 gene (blue arrow) indicating the position of exons (blue vertical lines), with an indication of their genomic location on chromosome 15. In total, 29 SNPs were analysed across an 86-kb interval. Black lines indicate the position of each SNP within DYX1C1. Inter-SNP LD was generated with Haploview. (a) D′ values are reported within cells while empty red cells represent full LD and empty blue cells represent lack of LD. (b) r2 values are reported within cells where empty white cells represent lack of LD and darker shadings represent increasingly stronger LD. Haploview identified six LD blocks (black solid lines) using the confidence interval method (Gabriel et al. 2002), but LD is strong all across the examined region.
