
Figure 5.
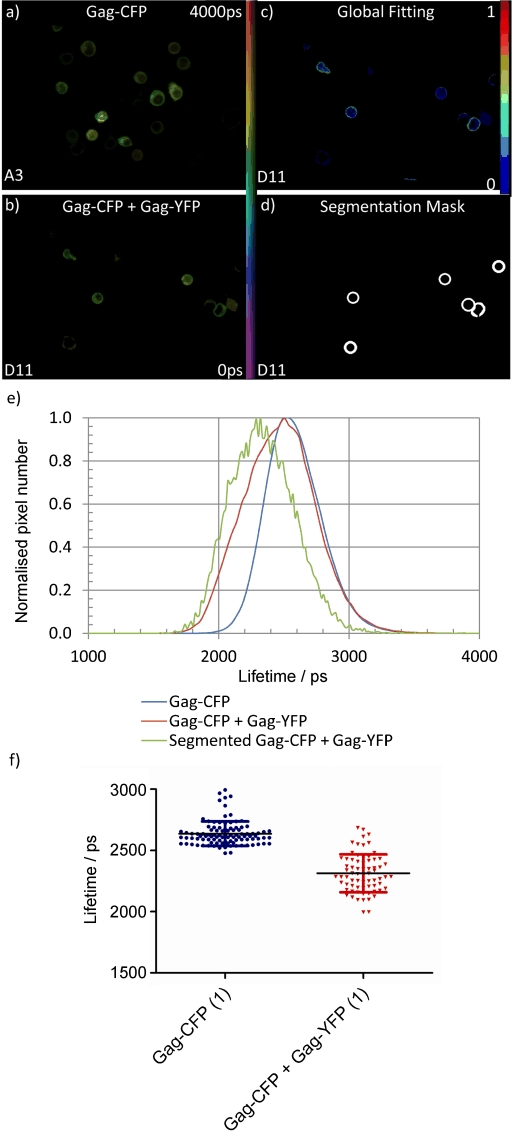
a,b) Fluorescence lifetime images of HEK cells with HIV virions expressing a) Gag–CFP only and b) Gag–CFP and Gag–YFP in an unknown ratio. c) Map showing the fraction of the short-lifetime component (τ2=1586 ps) obtained from globally fitting a double-exponential decay across the whole field of view with the first component fixed to 2580 ps. d) Image segmentation mask manually generated from the fluorescence intensity image in (b). e) Mean lifetime histograms corresponding to all pixels from 48 Gag–CFP-only wells (blue line), to all pixels from 47 Gag–CFP/Gag–YFP wells (red line) and to only pixels included in the manual segmentation mask over all 47 Gag–CFP/Gag–YFP wells (green line). f) The per-ROI lifetime analysis of all cells in all wells, that is, each membrane region is segmented and binned to produce a single decay profile, which is then fitted with a single-exponential decay model to calculate the mean lifetime.