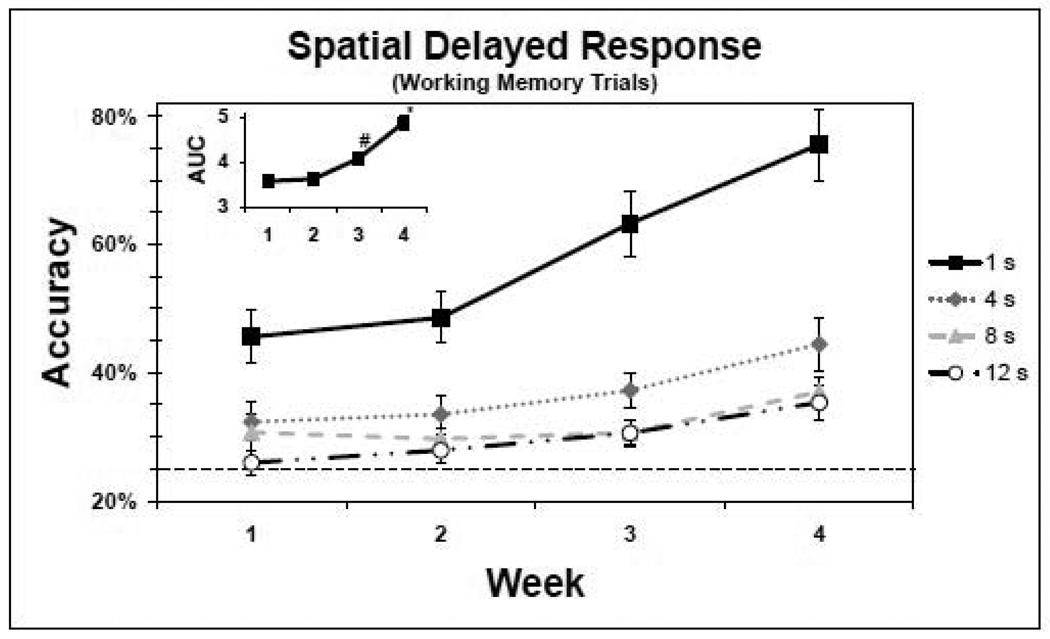
Figure 1.
Baseline performance of the spatial delayed response (SDR) task working memory (WM) trials (n=14). The y-axis represents the accuracy means (±SEM) of completed trials, and the x-axis represents the week. The dashed line indicates the chance rate of performance (25%). The solid line and square markers indicate performance for the 1 second (s) delay, the dotted line and diamond markers indicate performance for the 4 s delay, the dashed line and triangle markers indicate performance for the 8 s delay and the dashed and dotted line and circle markers indicate performance for the 12 s delay. The inset represents the corresponding AUC. *accuracy week 4 significantly improved compared to weeks 1, 2 and 3. #accuracy week 3 significantly improved compared to accuracy at weeks 1 and 2.

