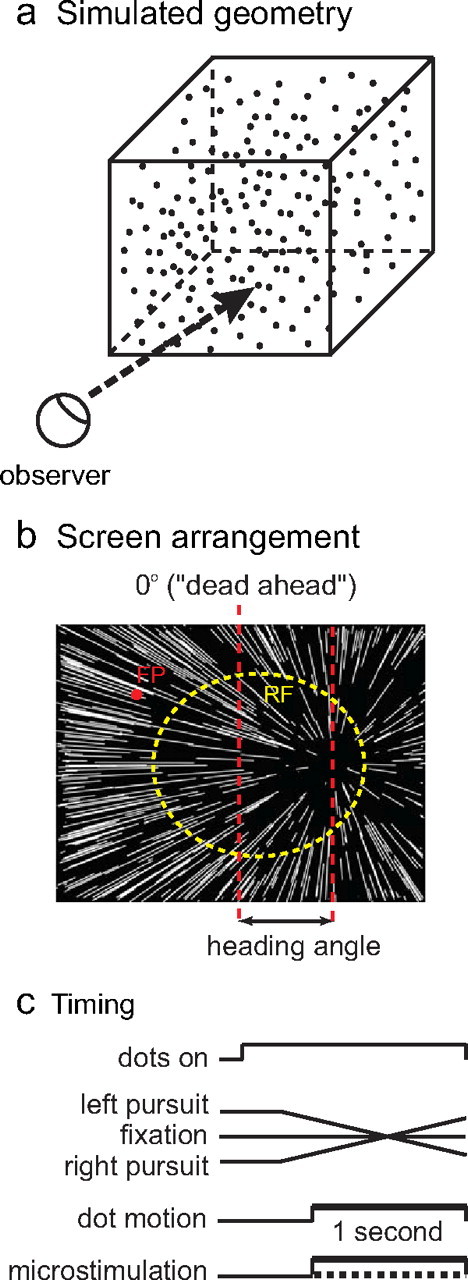
Figure 1.

Schematic of visual stimuli and experimental procedures. a, Geometry of simulated scene. b, Observer view of the stimuli, showing the pattern of dot motion on the screen. The red dot is the fixation point, and the dashed yellow circle indicates the receptive field of a typical VIP stimulation site. The longer vertical dashed line depicts dead ahead. The heading angle is defined as the angle between dead ahead and the simulated trajectory. c, Timing of events in a trial.
