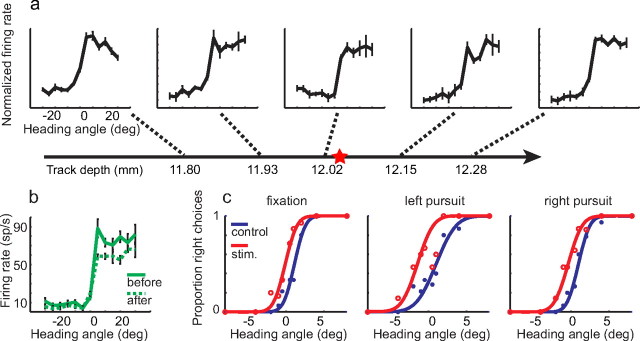
Figure 2.
Example of one experiment showing microstimulation effects. The horizontal line with arrowhead represents the electrode penetration. Multiunit activity was sampled (a) along the path. Threshold for spike detection was set to achieve a maintained discharge from 20 to 30 Hz, and each recording was independently normalized to the maximum firing rate at that location. In this case, neurons with similar tuning properties were found on a ∼600 μm distance along the penetration. Once a suitable (>500 μm) cluster was found, we placed the tip of electrode at the center of the cluster, as indicated by the red star on the electrode trajectory. In this case, this location was in the putative deep layers, ∼500 μm above the transition to white matter. Heading tuning curves before (solid green curve) and after (dashed green curve) microstimulation experiments are shown in b. The tuning properties are well preserved. c, Psychometric data resulting from this experiment. Midpoint shifts induced by microstimulation are −1.28, −2.01, and −1.46° (static, left, and right pursuit, respectively) and are consistent with the preference of this stimulation site. Error bars indicate SEM.

