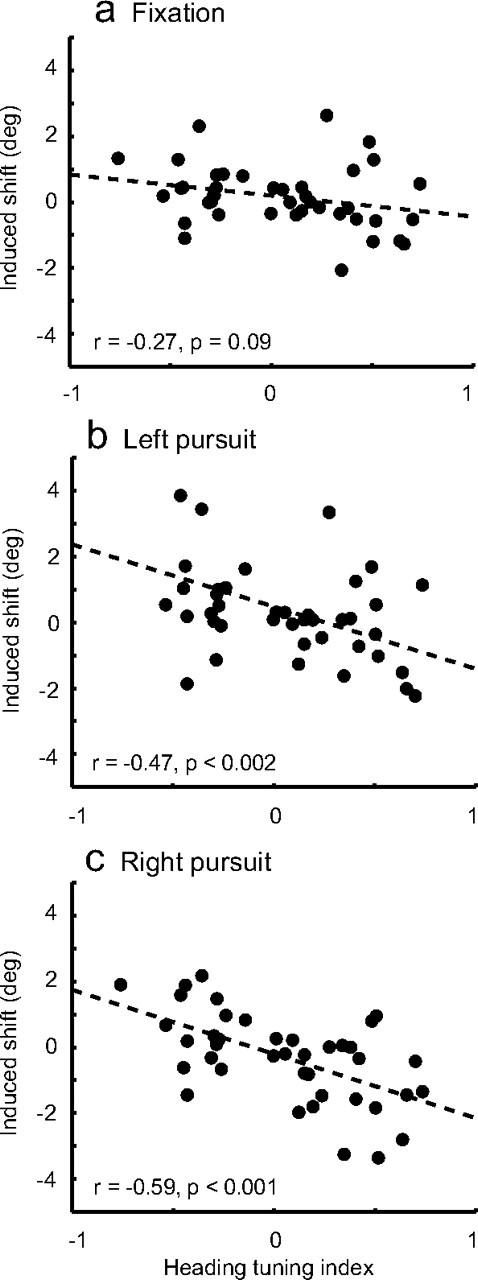
Figure 5.

a–c, Relationship between stimulation effect and site tuning strength for each fixation condition. The difference in slopes was only marginally significant, statistically (ANCOVA, p = 0.083). This analysis only included the 41 sites for which we collected tuning data.
