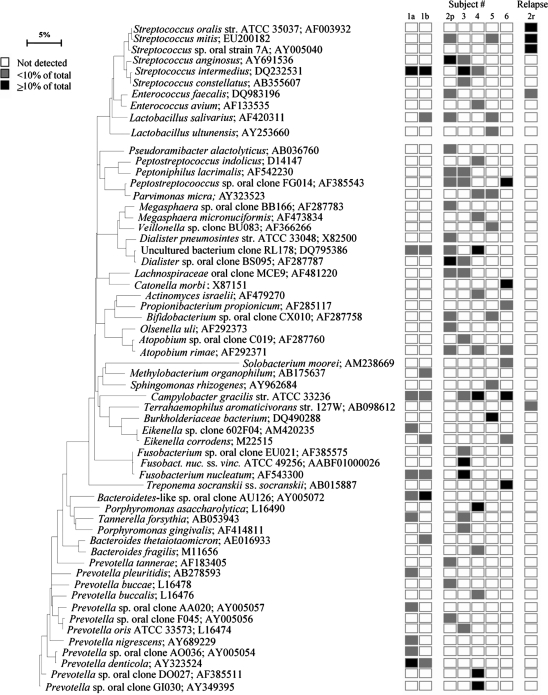
Fig. 1.
Bacterial profiles of mandibular osteoradionecrosis. Subject 1 is represented with two separate specimens (1a and 1b) from one lesion and subject 2 with a primary- (2p) and a relapse infection (2r). Distribution and levels of bacterial species/phylotypes among the eight samples from six subjects are shown by the columns of boxes to the right of the tree as either not detected (clear box), <10% of the total number of clones assayed (shaded/gray box), or ≥10% of the total number of clones assayed (dark box). 10% level was chosen arbitrarily. GenBank accession numbers are provided. Marker bar represents a 5% difference in nucleotide sequences.

