
Figure 1.
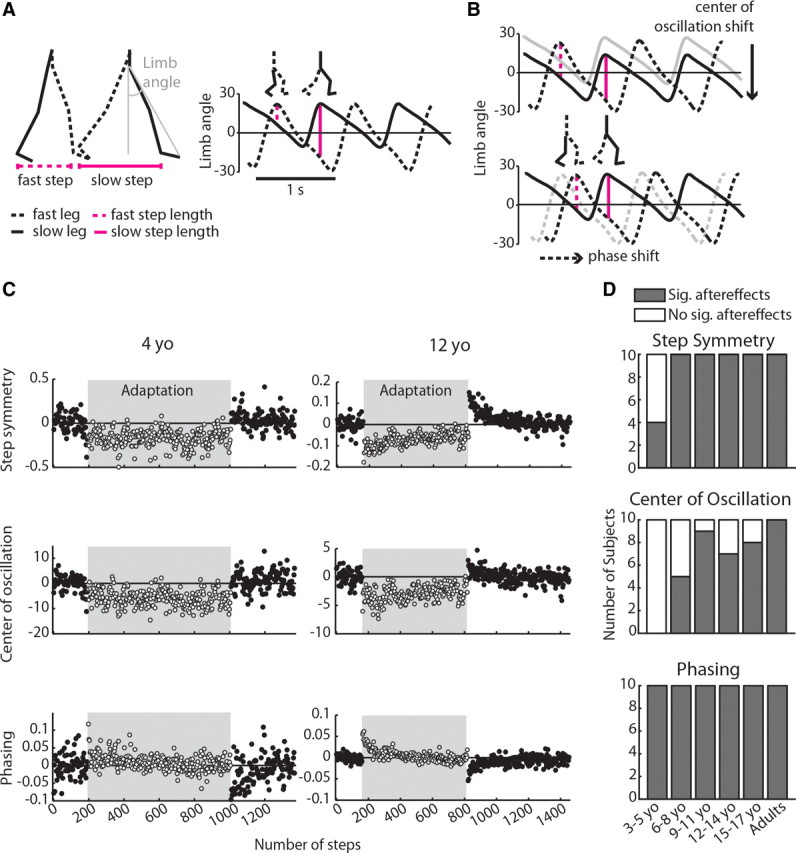
A, Calculations of step length and limb angle. Step length was measured as the distance between malleolus markers at heel strike and was defined as slow or fast depending on which leg was leading. Limb angle was calculated as the angle between a vertical axis from the greater trochanter and a vector drawn from the greater trochanter to fifth metatarsal (shown in gray); positive limb angles indicate flexion. The right plot shows limb angle plotted over 2.5 strides at the beginning of adaptation, with heel strike occurring at the maximums. A zero line, representing a neutral limb position directly under the body, is drawn for reference. Step length is directly proportional to limb angle and is represented by vertical magenta lines; stick figures above plot show limb positions at fast and slow heel strike, respectively. Note that, in early adaptation, the fast step is shorter than the slow step. B, Spatial strategy (top) and temporal strategy (bottom) for equalizing step length during adaptation. Using the spatial strategy, subjects can shift center of oscillation—the midpoint around which the limb oscillates—to lengthen the fast step and shorten the slow step (compare size of vertical lines with those in A). Using the temporal strategy, subjects can shift the phasing of limb angles to similarly equalize step lengths on the two sides. C, Adaptation to the split-belt treadmill for an example 4 year old (left column) and a 12 year old (right column). Each point represents an average of three steps; steps taken during adaptation on split belts are shown in the shaded region. For each interlimb coordination parameter shown, zero represents baseline symmetry and deviations from zero represent asymmetric coordination. Note that, although the 12 year old adapted and showed significant aftereffects in all three measures of interlimb coordination, the 4 year old only showed significant aftereffects in the temporal measure (phasing). These plots are scaled separately for each subject because of the variability in the data of the 4 year old. D, Number of subjects within each age group with significant (gray bars) and nonsignificant (white bars) aftereffects in each of the three measures of interlimb coordination: step symmetry, center of oscillation, and phasing.