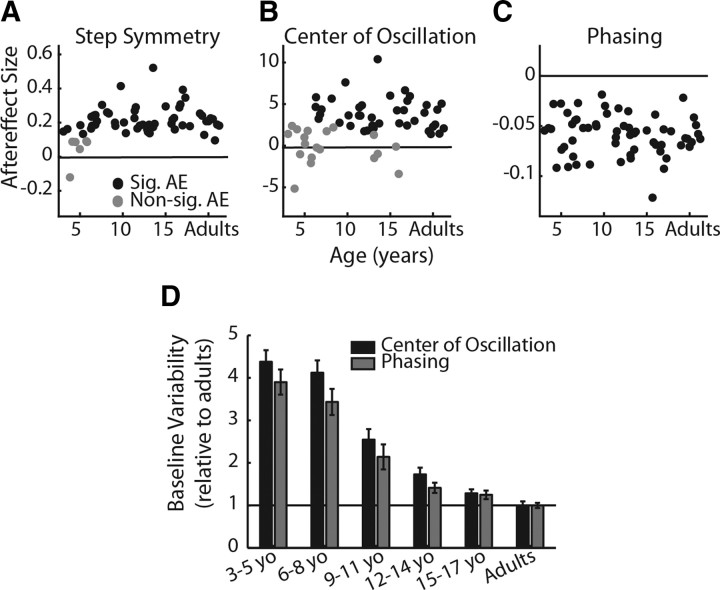
Figure 2.
Step symmetry (A), center of oscillation (B), and phasing aftereffect sizes (C) relative to age. Subjects who did not show significant aftereffects are shown in gray dots; and subjects who had significant aftereffects are shown in black. For both step symmetry and center of oscillation, the mean aftereffect of subjects who did not adapt (gray) was significantly smaller than the mean aftereffect of those who did adapt (p < 0.001). D, Variability during baseline stepping across age groups (n = 10 for each group) for center of oscillation (black bars) and phasing (gray bars). Bars indicate mean SD ± SE during baseline as a proportion of the SD of adult stepping during baseline. For example, 3–5 yo stepping was approximately four times more variable than adult stepping for both center of oscillation and phasing. There was no significant difference between variability in center of oscillation and phasing data across age groups (p = 0.27).

