
Figure 5.
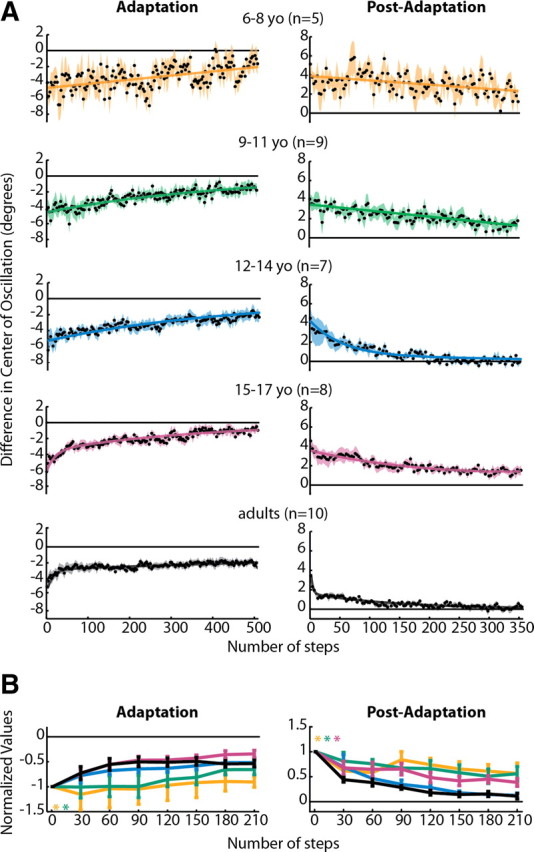
A, Averaged adaptation and post-adaptation center of oscillation data for all subjects who showed significant aftereffects. Data are displayed as in Figure 4. Note that data from 3–5 year olds is not shown, because none from this age group showed significant aftereffects. Linear functions resulted in the best fit for 6–8 yo adaptation and post-adaptation and 9–11 yo post-adaptation. Single-exponential functions resulted in the best fit for 9–11 and 12–14 yo adaptation. Double-exponential functions were the best fit for 12–14 yo post-adaptation, 15–17 yo adaptation and post-adaptation, and adult adaptation and post-adaptation. Adjusted r2 values are listed in Table 3. B, Comparison of center of oscillation adaptation and post-adaptation across age groups, as shown in Figure 4B. Significant main effects for age were found for adaptation and post-adaptation; age groups that were found to be significantly different from adults are shown by colored asterisks.