
Figure 6.
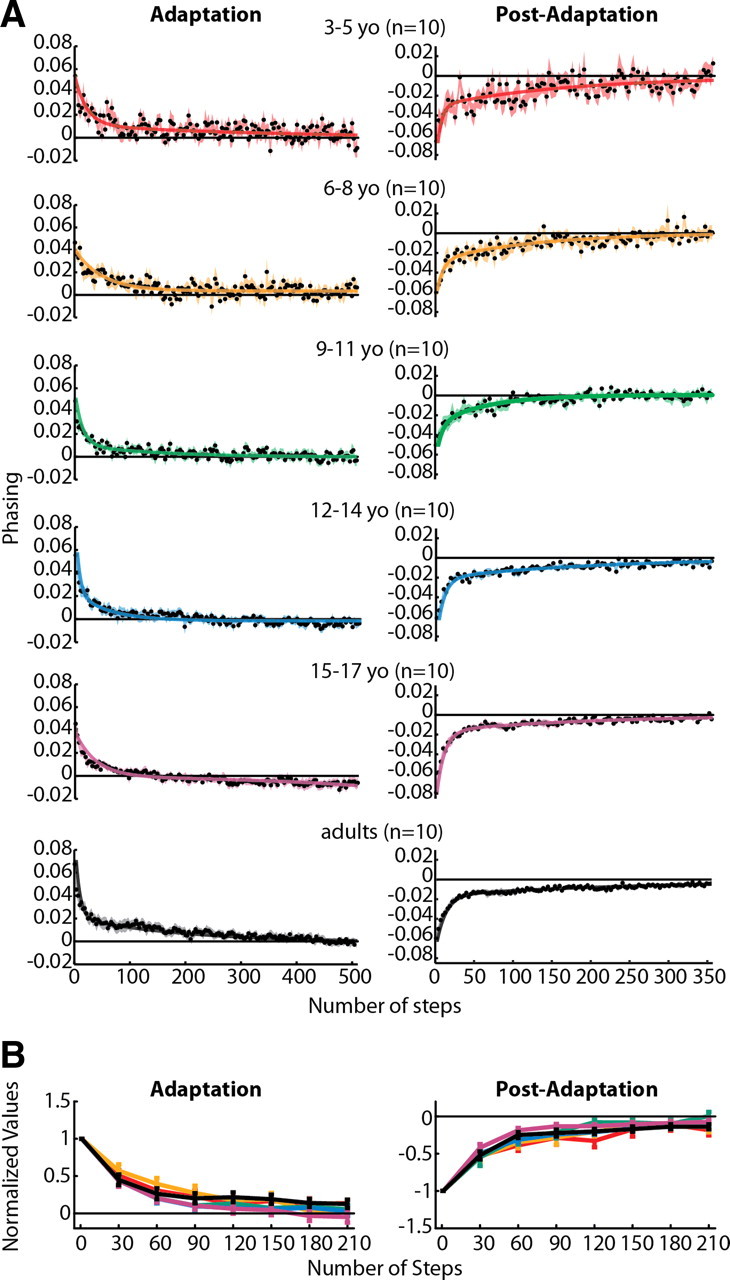
A, Phasing adaptation and post-adaptation data for all subjects who showed significant aftereffects (for phasing, this included all subjects tested). Data are displayed as in Figure 4. In contrast to step symmetry (Fig. 4) and center of oscillation (Fig. 5), adult-like double-exponential functions fit all data regardless of age (adjusted r2 values listed in Table 3). B, Comparison of phasing adaptation and post-adaptation across age groups, as shown in Figure 4B. No significant main effects for age were found for either phasing adaptation or post-adaptation.