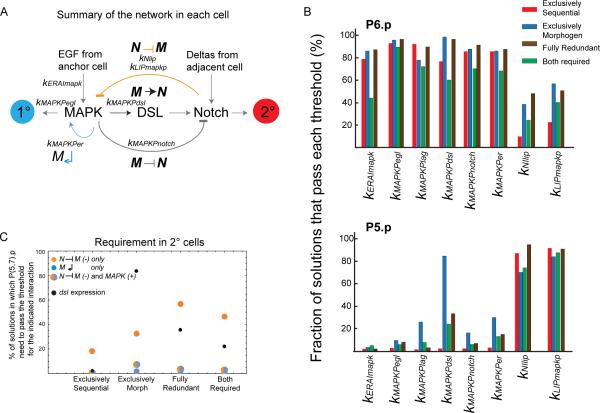
Figure 4. Variation in activation and requirement for different network components in the different patterning modes.
(A) Vulval induction network scheme showing the interactions between MAPK and Notch pathways within a cell, with external input from adjacent cells in the six-cell row. (B) Percentage of solutions of each patterning mode for which a given event occurs in P6.p (upper panel) or P5.p (lower panel). An event is defined as occurring when a given protein concentration reaches the threshold for a specified interaction (kAb denotes the concentration in factor “A” where downstream factor “b” is half-activated, see Supplement). n=500 solutions from each mode. (C) Percentage of solutions belonging to each patterning mode in which P(5,7).p need to pass the indicated threshold to become 2°: Lip1 threshold to activate N ⊣ M (yellow), MAPKP threshold to activate M↵ (blue), both of them (not necessarily at the same time) (yellow-blue dot), MAPKP threshold for dsl expression (black). See also Figure S4 and Table S5.

