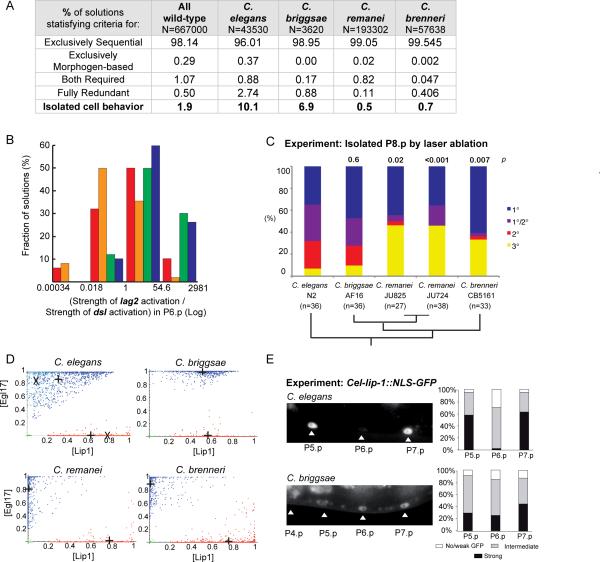
Figure 6. Prediction and experimental confirmation of interspecific variation in the propensity for isolated 2° fates (A–C) and in Notch pathway activation in P6.p (D–E).
(A) Percentage of solutions of each species set that belong to each of the four patterning modes. Caenorhabditis species solutions differed in their capacity to stabilize an isolated 2° cell at intermediate EGF doses (p<0.001, d.f.=3, G test of independence after Williams correction=11726.1). (B) Histograms showing the distributions of the ratio between the strength (flux value) of lag2 activation over the strength of dsl activation by MAPKP in P6.p (n=500 solutions from each species). The median value is 0.5 for C. briggsae (orange), 1.7 for C. elegans (red), 12.5 for C. brenneri (blue) and 27.0 for C. remanei (green). (C) Experimental proportions of fates adopted by an isolated P8.p cell in different species. p s of isolated 2° cells compared to C. elegans are noted above the bars. Phylogenetic relationships [27] are indicated below. (D) Fate plane distributions of P6.p (blue) and P5.p (red) in the Caenorhabditis species solutions (n=1000 solutions for each). Crosses indicate the average cell position. In the C. elegans graph, the paler dots and “X” correspond to “C. elegans N2”. (E) Experimental test of the prediction in (D). On the left, representative fluorescence micrographs show Cel-lip-1∷GFP expression in Pn.p nuclei in C. briggsae AF16 (mfIs29 transgene) and C. elegans N2 (zhIs4 transgene) backgrounds. The same pattern was observed with an independent C. briggsae transgenic line (mfIs30 transgene, obtained from another injected animal). Histograms on the right show semi-quantitative measurements of Cel-lip-1 reporters. Data for C. elegans are from [10], placed on a semi-quantitative scale for comparison with C. briggsae. Differences between P(5–7).p are not (or marginally) significant in C. briggsae, but highly significant in C. elegans. χ2 tests: p=0.054 in C. briggsae (n=78), p=3.10−8 in C. elegans (n=40). See also Figure S6 and Table S8.

