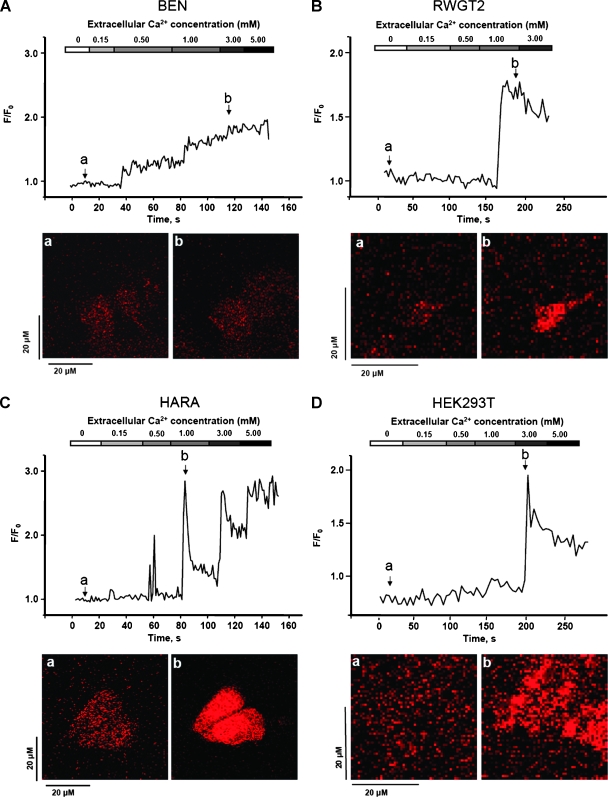
Figure 2.
Increasing [Ca2+]o induced a biphasic Ca2+i rise in lung SCC cells. (A–D) The graphs are representative of fluo-3 fluorescent Ca2+i responses observed in typical experiments using each lung SCC line and HEK293T cells. Ca2+i baseline was measured in 0.0 mM Ca2+ solution, and Ca2+i oscillations were initiated by the addition of 0.15 mM Ca2+. The panels below are confocal microscopy images depicting fluo-3-loaded cells at baseline (a) and subsequent emittance of fluorescence on stimulation with Ca2+o (b). Magnification, x10.

