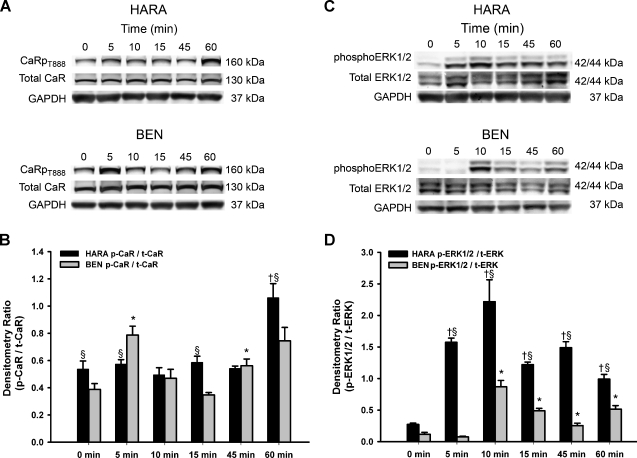
Figure 5.
Ca2+o induced CaR phosphorylation at threonine 888 and ERK1/2 phosphorylation. (A) Western blots of protein lysates from 5.0 mM Ca2+ treated BEN and HARA cells at various time points probed with CaRT888 phosphorylation-specific antibody. GAPDH Western blot serves as a loading control. (B) Densitometry: the levels of phosphorylated CaR were normalized to total CaR and GAPDH. Results were from three experiments. Bars, SEM. *BEN p-CaR/t-CaR: P < .05, compared to 0 time point. †HARA p-CaR/t-CaR: P < .05, compared to 0 time point. §BEN p-CaR/t-CaR versus HARA p-CaR/t-CaR: P < .05. (C) Western blots of protein lysates from 3.0 mM Ca2+-treated BEN and HARA cells at various time points probed with antibodies against ERK1/2 phosphorylation, total ERK, and GAPDH. (D) Quantitative analysis by densitometry. The levels of phosphorylated ERK1/2 were normalized to total ERK and GAPDH as above. Bars, SEM. *BEN p-ERK1/2/t-ERK: P < .05, compared to 0 time point. †HARA p-ERK1/2/t-ERK: P < .05, compared to 0 time point. §BEN p-ERK1/2/t-ERK versus HARA p-ERK1/2/t-ERK: P <.05.

