Figure 5.
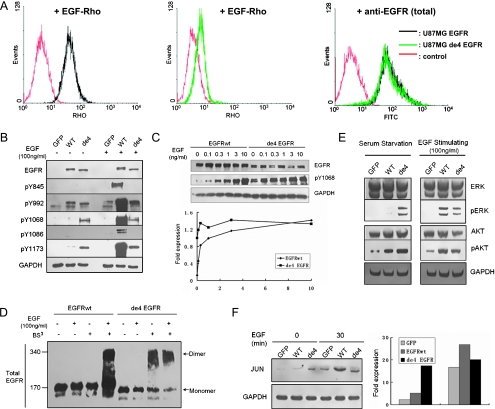
Oncogenic signaling of de4 EGFR. (A) Flow cytometry analysis for EGF-Rho binding affinity. Reactivity was tested on U87MG-EGFR (left) and U87-de4 EGFR (middle). Expression of total EGFR was assessed first (right). Autofluorescence blanks are also shown (red). (B) Tyrosine phosphorylation of EGFRwt and de4 EGFR treated with or without EGF for 8 minutes. Y1068 and Y1173 were phosphorylated in the presence of de4 EGFR in the absence of EGF activation. GAPDH served as an internal control. (C) U87MG transfectants expressing either EGFRwt or de4 EGFR were incubated with increasing EGF concentrations. The phosphorylation of Y1068 was analyzed by immunoblot analysis with the indicated antibodies. Phospho-EGFR levels were quantified according to band intensities. (D) Dimerization analysis of EGFRwt and de4 EGFR. Cells were treated with or without EGF (100 ng/ml; 8 minutes) and incubated with or without a covalent cross-linking reagent, BS3 (2mM, 20 minutes). EGFR dimers and monomers are indicated, respectively. (E) General signaling pathways relating to EGFR. ERK and AKT are activated in the presence of de4 EGFR. GAPDH served as an internal control. (F) The relative levels of JUN were determined by immunoblot analysis. The bands were quantified according to band intensities. GAPDH served as an internal control.

