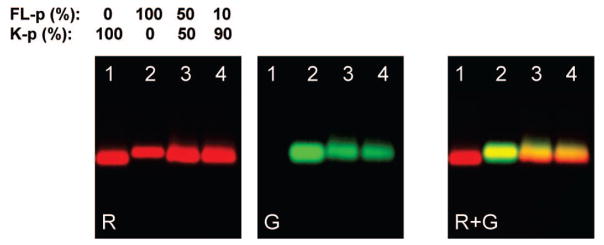
Figure 1.
Gel electrophoresis of FL-pc-QDs and pc-QDs samples (red-emitting QDs). The respective percentages of K-p and FL-p used for the preparation of each sample loaded are indicated above each lane. The images show the red (R) and green (G) channel scans as well as an overlay (R + G). All samples migrate at the same speed as pc-QDs (red only) and retain a narrow width, demonstrating monodispersion.

