FIGURE 7:
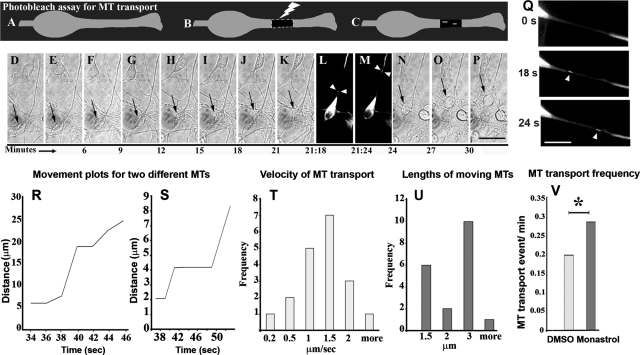
Real-time imaging reveals transport of short MTs in the leading process. In the photo-bleach assay, cultured migrating neurons expressing eGFP–tubulin (A) are exposed to a laser to create a bleached zone in the leading process (B). MTs moving from the proximal unbleached region to the distal region are visible against the dark background of the bleached zone (C). (D–K) and (N–P) Phase-contrast, time-lapse images track migration of an eGFP–tubulin–transfected neuron (black arrows) before and after photo-bleaching. (L and M) Fluorescence, time-lapse images reveal transport of short MTs (white arrowheads) through the bleached zone. Scale bar, 10 μm. (Q) Magnified images showing the bleached region at zero time-point (top panel), and a short MT moving through the photobleached zone (middle and bottom panels, arrowheads). Middle and bottom panels are magnified views of L and M, respectively. Scale bar, 10 μm. (R and S) Movement plots for two different anterogradely moving MTs are shown. Each point represents the position of the MT from the proximal end of the bleached zone, measured along the leading process. The x-axis represents the time elapsed since the beginning of the movie. (T) Frequency histogram of average velocities in μm/s of 19 MTs. (U) Frequency histogram of lengths of 19 MTs. (V) MT transport frequency is significantly higher in monastrol-treated neurons (13 events in 45 min) compared with DMSO-treated neurons (6 events in 30 min).

