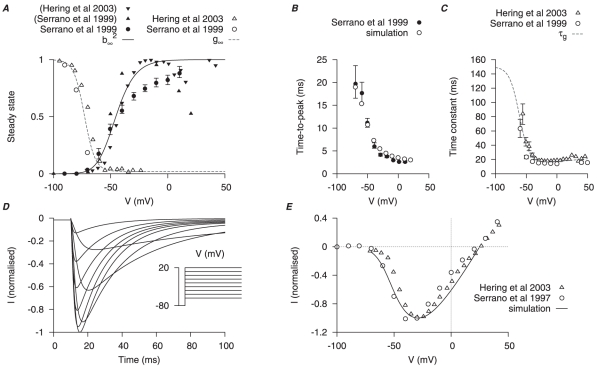
Figure 3. Myometrial  model.
Properties of  are derived primarily from experimental data of Serrano et al., [43] and Hering et al., [44]. A, V-dependent steady-states of activation (
 ) and inactivation (
 ); experimental data in brackets were extrapolated from the published I–V relationships and normalized to the maximum value. B, superimposed simulated and experimental time-to-peak of
  at different V stepped from
  of
of  ; a function for the V-dependent activation time constant is chosen so that the simulated time-to-peak (empty circles) matched the experimental data (solid circle). C, V-dependent inactivation time constant (
 ). D, simulated
  at voltage steps of
  to
to  from a
  of
of  ; E, simulated peak I–V relationship of
  and experimental I–V data. In both D and E, all data are normalized to the peak current value at
  .
.

