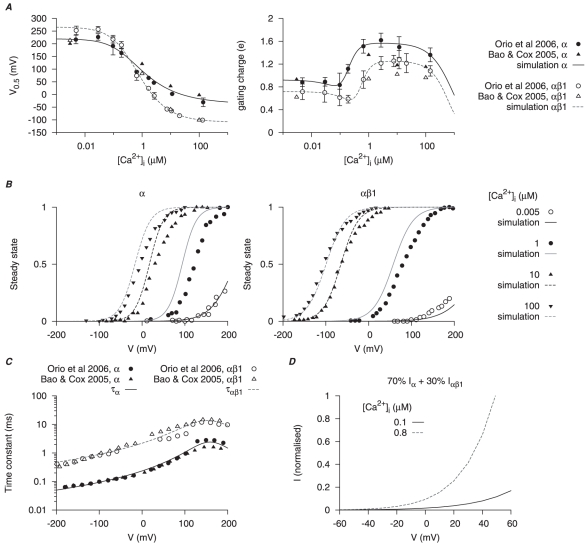
Figure 8. Myometrial  model.
The calcium- ( ), voltage- (V) and time-dependent kinetics for the two types of
  currents,
  and
and  , are developed with experimental data from cloned mammalian myometrial and smooth muscle MaxiK
  and
and  subunits expressed in Xenopus laevis oocytes [63], [64]; the current density and proportion of
  are adjusted with I–V relationships from different mammalian myometrial cells [17], [65], [66]. In A and C, solid and empty circles are experimental data for
  and
and  respectively. A,
  -dependent half-activation (
 ) and activation gating charge. B, simulated activation steady-states for
  and
and  at different
  ; solid and empty circles are experimental data from Orio et al., [64] and Bao & Cox [63] respectively. C, V-dependent activation time constants for
  and
and  . D, simulated I–V relationships of
  at anticipated myometrial resting and peak
  levels, with the proportion of
  . Both I–V relationships are normalized to
  at
at  at peak
  level.

