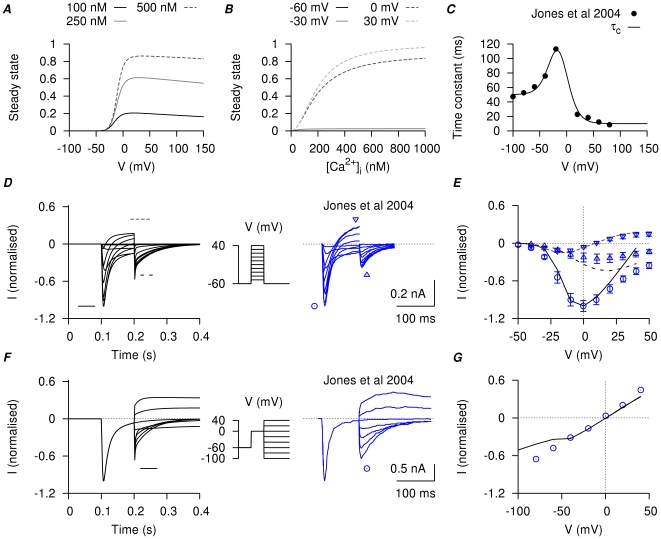
Figure 10. Myometrial  model.
The steady-state of  is modified from Arreola et al., [77]. A, steady-state of
  with respect to V in three different
  concentrations; B, steady-state of
  with respect to
  at four different membrane potentials. C, V-dependent activation time constant; the experimental data points are obtained by fitting the tail currents in figure 2 of Jones et al., [15]. D, simulated currents (left) and the corresponding experimental currents in Jones et al., [15] (right) elicited by a single-step voltage-clamp protocol (inset). The peak of the inward currents, the current values at the end of the voltage pulse, and the peak of the tail currents were marked for both simulated current (lines) and experimental current tracings (circles). E, I–V relationships, showing the marked peak at each voltage step in D. F, simulated currents (left) and the corresponding experimental currents in Jones et al., [15] (right) by a two-step voltage-clamp protocol (inset). The peak of the tail currents were marked for both simulated current (lines) and experimental current tracings (circles). G, I–V relationships, showing the marked peaks of the tail currents at each voltage step in F. The simulated currents qualitatively reproduced the experimental current tracings in both voltage-clamp protocols, with almost zero net current at the holding potential and comparable amplitude and rate of decay of the tail currents.

