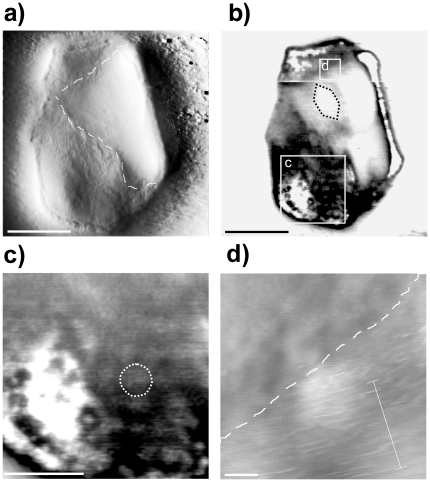
Figure 2. AFM images of a H. walsbyi folded cell.
Amplitude (a) and phase (b) images show a cell with its upper right-hand corner folded. Enlarged images of the white boxed areas show the spotted region (c) and the striped region (d); the dashed line is a guideline along the border of the folded corner. Scale bars: 1 µm (a, b), 400 nm (c), 100 nm (d).

