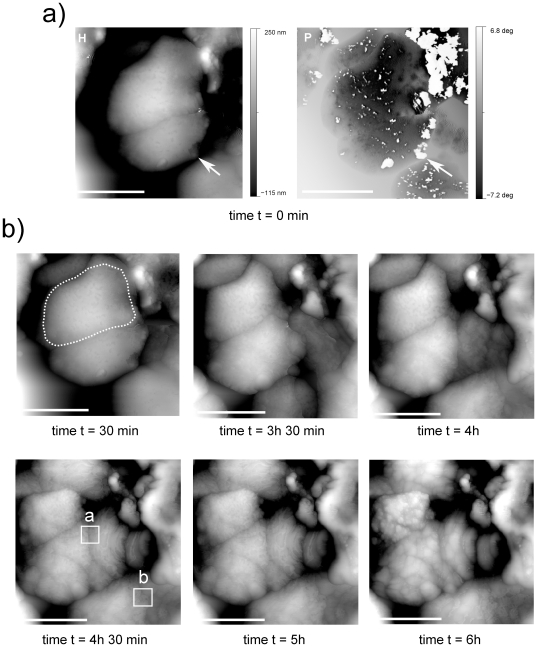
Figure 5. AFM images of H. walsbyi cell evolution during the drying process.
a) Height (H) and phase (P) images of cells at the beginning of the process (time t = 0). In height imaging, cells present an external capsule appearing as a thin film disrupted in some locations. One big laceration is indicated by the white arrow. In phase imaging, capsule lacerations correspond to white spots. In the following height images (b) acquired at different times during the drying process, the cells decrease in volume and lose their capsule, uncovering the underlying cell layer. Scale bar 2 µm.

