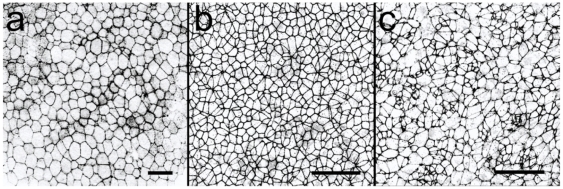
Figure 1. High magnification images of small areas of the chick embryo.
A: stage EG XII, prior to streak formation; B: stage HH2, lateral to the
streak; C: stage HH2, within the streak region. The embryo in image A is
stained with rhodamine phalloidin to visualize the F actin cortex, while
the embryos shown in B and C are stained with an antibody against the
apically localized tight junction marker ZO-1. The areas shown are
375 375
375
 in A, and
187.5
 187.5
187.5
 in B and
C. The scale bars represent 50
  in all
three panels.

