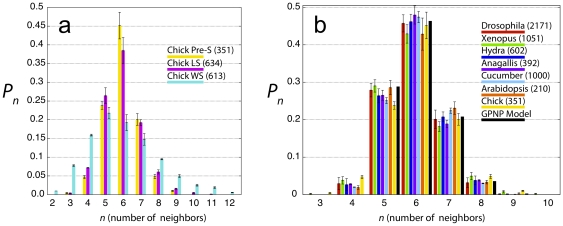
Figure 2. Experimental CNN histograms.
A) Histograms of cell neighbor numbers for the three regions of the chick embryo shown in Figure 1; B) Comparison of the pre-streak chick histogram (yellow) with histograms reported in the literature: Drosophila (red), Xenopus (green), and Hydra (blue) [2]; Anagallis (purple) and cucumber (cyan) [7]; and Arabidopsis (orange) (reanalyzed using image from [6]). Also shown is the histogram of the GPNP model (black). Numbers in parentheses indicate number of cells counted in each tissue.

