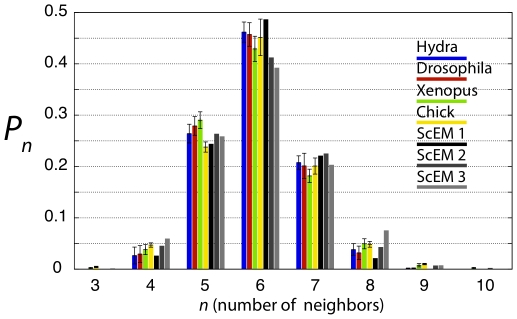
Figure 4. Computational CNN histograms.
Histograms measured from spatial simulations of epithelial cell proliferation using the Subcellular Element Model, with three different rates of cell growth, compared with the animal subset of experimentally measured histograms described in Figure 2B.

