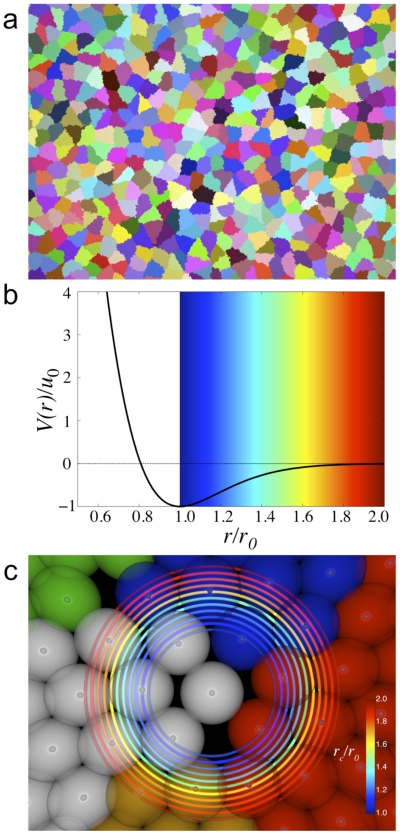
Figure 7. ScEM simulations.
(a) An example of cell morphology of a cell sheet grown in two dimensions
using the ScEM with 128 to 256 elements per cell. Cells are colored
randomly in order to distinguish cells. (b) The scaled intercellular
interaction potential between elements. Beyond the equilibrium distance
 there are
decaying interactions between elements. This region is outlined with a
color gradient. (c) High magnification of elements of several
neighboring cells. Cells are distinguished by different colors.
Demonstrated here are the different cut-off ranges for which two
elements from different cells are considered to be interacting strongly
enough that their associated cells are neighbors. The cut-off range is
 , and
, and
 is the
diameter of an element and/or the equilibrium distance of the
interaction potential shown in (b).

