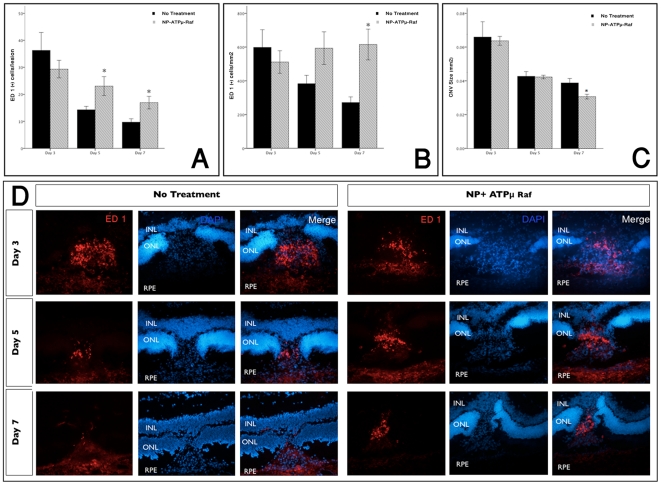
Figure 6. Increased macrophage infiltration at the site of treated CNV.
Macrophage infiltration was highest on day 3 with gradual decrease on days 5 and 7. Significantly higher number of macrophages were observed with the NP-ATPμ-Raf treated group compared to the control group on days 5 and 7 (A and B). There was a statistically significant reduction of CNV size noted on day 7(C). Immunofluorescent staining of representative frozen sections (x20) obtained at 3, 5, and 7 days after laser photocoagulation for ED 1, a marker for macrophage (D). *P<0.01. Data are expressed as the mean ± SE.

