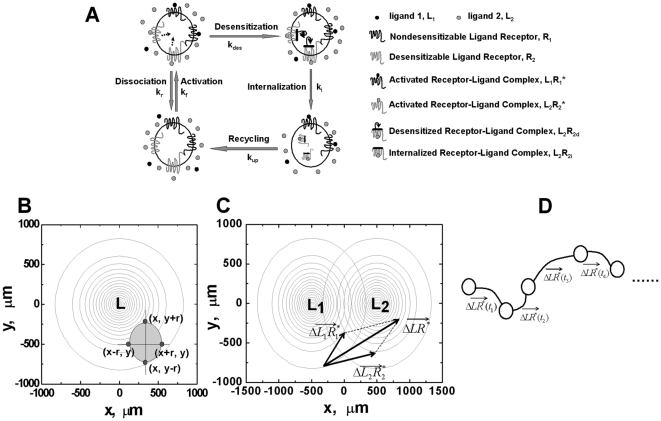
Figure 1. Schematic illustration of the model.
(A) Receptors are initially expressed on the cell surface. Upon binding to the ligand molecules, the receptors are activated and trigger chemotactic signaling. Activated receptor-ligand complexes are rapidly deactivated (i.e., desensitization) which are subsequently internalized and eventually re-expressed back to the cell surface. (B) The cell is modeled as four receptor expressing units symmetrically located along the x and y axis with equal distance to the center of mass of the cell. In a single ligand gradient, the active receptor-ligand complex LR* is evaluated for all four receptor expressing units of the cell, and the difference of LR* along the x and y axis is calculated to determine the orientation strength in the two directions. The net orientation of the cell is determined by the orientation vector  in the 2-D plane. (C) In competing gradients of two ligands L1 and L2, the orientation vector of the cell to each ligand is evaluated and the net orientation vector of the cell is determined by the addition of the orientation vectors to L1 and L2. (D) The model cell is allowed to move along the direction set by the net orientation vector
  . The migration step time is set to be directly proportional to the magnitude of the orientation vector with the optimal step time of 2.5 minutes. The migration speed is set at 10 µm/min. Within each migration step, the cell turns from its previous migration direction to the new direction set by the orientation vector at the turning rate directly proportional to the magnitude of the orientation vector through multiple sub-steps.

