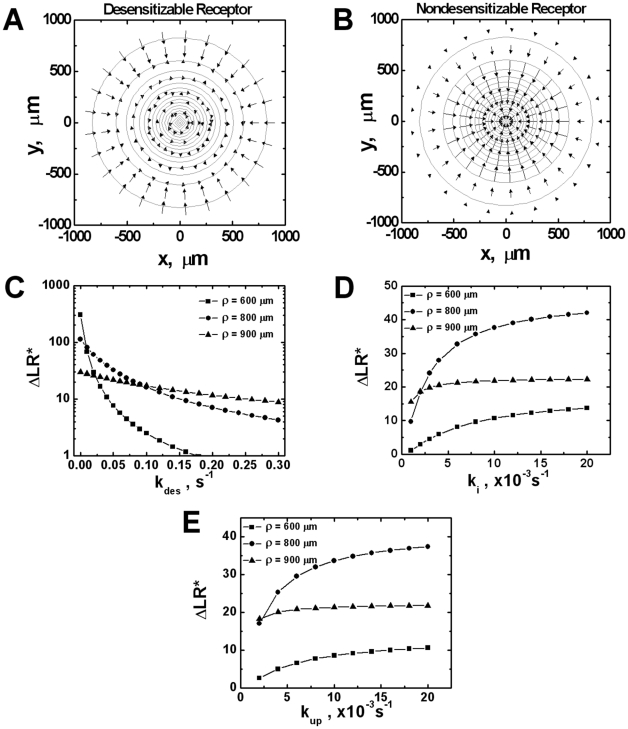
Figure 2. Comparison of orientation of cells expressing desensitizable and nondesensitizable receptors in a single ligand gradient.
(A) Desensitizable receptors; (B) Nondesensitizable receptors. The cell orientation is represented by arrows in the figures and the length of the arrows indicates the strength of the orientation. The ligand gradient is represented by contour plot with the highest ligand concentration (17.6 nM) at the center of the contours for each gradient. The ligand concentration at the outmost contour circle is 0.1 nM, and the concentration difference between adjacent circles is 1.0 nM. Because of the magnitude difference between the orientation vector of cells expressing desensitizable and nondesensitizable receptors, the length of the arrow is adjusted with a scaling factor of 1.2 for desensitizable receptors, and 0.1 for nondesensitizable receptors. (C–E) The dependence of cell orientation strength (ΔLR*) on desensitization rate kdes (C), internalization rate ki (D) and up-regulation rate kup (E) for cells locates at ρ = 600 µm, 800 µm and 900 µm. ρ is defined in Equation 9 and Table 1. Unless indicated otherwise, kdes is fixed at 0.065 s−1, kup at 0.004 s−1 and ki at 0.0033 s−1.

