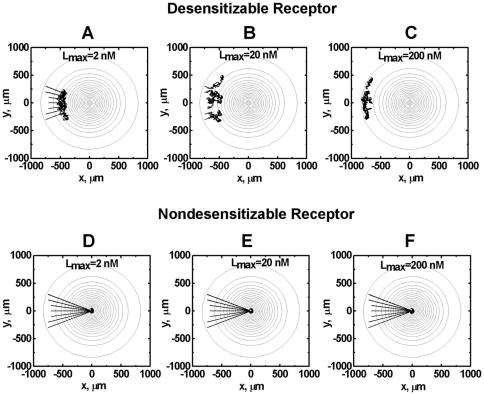
Figure 3. Comparison of migration of cells expressing desensitizable and nondesensitizable receptors in different single ligand gradients.
(A–C) Desensitizable receptors; (D–F) Nondesensitizable receptors. The highest ligand concentration at each gradient center is 2 nM (A, D), 20 nM (B, E) and 200 nM (C, F). Seven representative cell tracks are shown for each simulation. The total time of simulated cell migration is 150 minutes, and the end of the tracks is indicated by solid circles.

