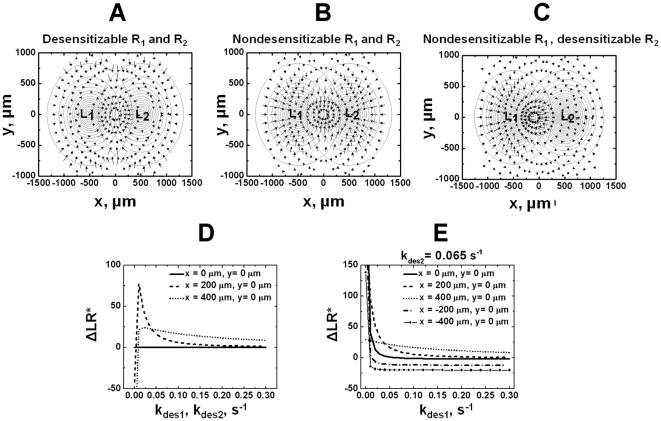
Figure 4. Cell orientation in competing ligand gradients at the steady state.
(A) In competing gradients of L1 and L2, cells expressing normal desensitizable receptors for both ligands orient toward the distant ligand gradient. i.e., cells that are close to L1 orient toward L2 and cells that are close to L2 orient toward L1. (B) Cells expressing nondesensitizable receptors for both ligands orient toward the local ligand gradient. i.e., cells that are close to L1 orient toward L1 and cells that are close to L2 orient to L2. (C) Cells expressing nondesensitizable receptor for L1 but desensitizable receptor for L2 orient toward the nondesensitizing ligand gradient L1. This effect is clear in the region where the two ligand gradients are significantly overlapped. The ligand gradients are represented by contour circles with the highest ligand concentration (17.6 nM) at the center of the contours for each gradient. The ligand concentration at the outmost contour circle is 0.1 nM, and the concentration difference between adjacent circles is 1.0 nM. Because of the magnitude difference between the orientation vector of cells expressing desensitizable and nondesensitizable receptors, the length of the arrow is adjusted, i.e., the scaling factor is set at 0.8 for Figure 4A, and 0.07 for Figure 4B and 4C. (D–E) The dependence of cell orientation (ΔLR*) on kdes1 and kdes2 for L1 receptor and L2 receptor respectively that vary at the same time (D), or on kdes1 for L1 receptor (E), for cells locates at different positions in the overlapping area of L1 and L2. Positive ΔLR* indicates cell orientation toward L1 and negative ΔLR* indicates cell orientation toward L2.

