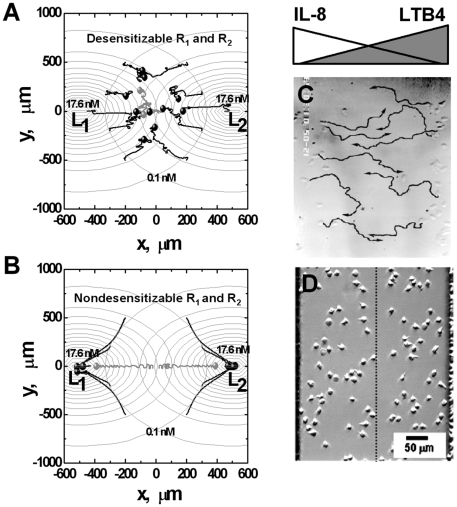
Figure 5. Comparison between simulation and previous experimental results of cell migration in opposing ligand gradients.
(A, B) Simulation results; (C, D) Experimental results. (A) Cells expressing normal desensitizable receptors migrate toward the distant chemoattractant source. (B) In contrast, cells expressing nondesensitizable receptors migrate toward the local chemoattractant sources. The total time of simulated cell migration is 75 minutes. Twelve representative cell tracks (the starting positions of cells are consistent in (A) and (B)) are shown. The end of the tracks is indicated by solid circles. The concentration difference between adjacent circles is 1.0 nM. Grey cell tracks demonstrate the differential stability of random migration in the center zone; (C) 90 min migration tracks of neutrophils in competing gradients of IL-8 and LTB4 from experimental studies in under agarose assay [12]. Cells migrate toward the distant chemoattractant source (Reproduced from Reference 12 with the permission from The Journal of Cell Biology for noncommercial third-party use.). (D) Neutrophil migration in opposing linear gradients of IL-8 (0–6 nM/350 µm) and LTB4 (0–5.3 nM/350 µm) in a microfluidic device [16] (Reproduced from Reference 16 with the permission from Springer.). Most cells of the “left” population polarized to the right and most cells of the “right” population polarized to the left.

