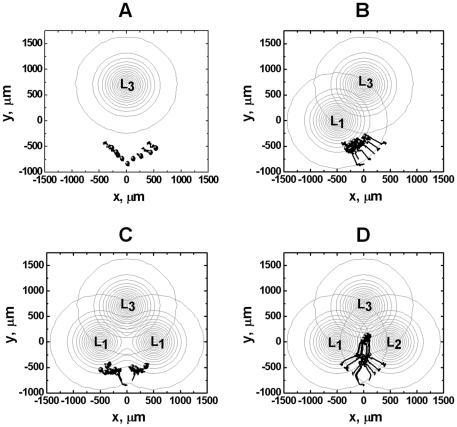
Figure 7. Comparison of strategies for directing cells to the distant target as shown by simulation of cell migration in different ligand gradient configurations.
(A) Single ligand gradient from the distance could not reach and attract cells. (B) The distant target L3 combined with the closer ligand L1 could not effectively attract cells further toward the distant target as the cell may reach the high-dose saturation region of L1 field before it senses L3 gradient. (C) The distant target L3 combined with angled competing gradients of two identical ligands L1 could not effectively attract cells further toward the distant target. (D) The distant target L3 combined with angled competing gradients of two different ligands L1 and L2 effectively attract cells toward the distant target. The total time of simulated cell migration is 150 minutes. Nine representative cell tracks are shown, and the starting positions of the tracks are consistent in all simulations. The end of the tracks is indicated by solid circles.

