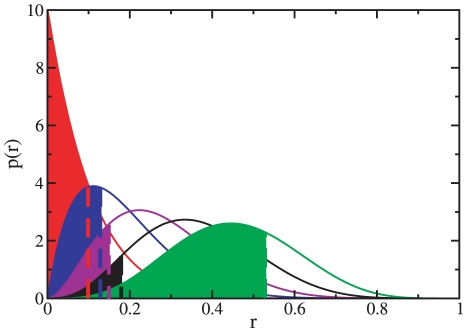
Figure 2. Probability distributions of the scores
 of
vertices external to a given subgraph
  of the
graph.
The score  is the
 -th
smallest score of the external vertices. In this particular case there
are
  external vertices. In the figure, we plot
 ,
,
 ,
,
 ,
,
 ,
,
 (from left
to right). As an example, the shaded areas show the cumulative
probability
  for a few
values of
  that would
correspond to the values estimated in a practical situation. In this
case, the black area,
  , is the
least extensive and so
  . If
. If
 , the
vertices with scores
  ,
,
 ,
,
 and
and
 will be
added to
  .
.

