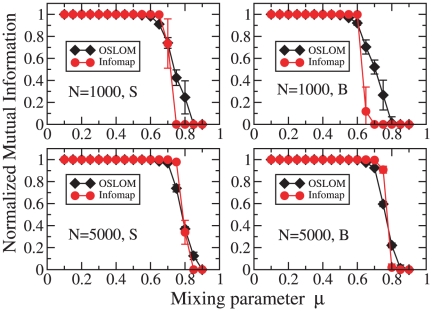
Figure 6. Tests on undirected and unweighted LFR benchmark graphs without overlapping communities.
The parameters of the graphs are: average degree
 ,
maximum degree
  ,
exponents of the power law distributions are
 for
degree and
  for
community size, S and B mean that community sizes are in the range
 (“small”) and
  (“big”), respectively. We considered two network sizes:
 (top)
and
  (bottom). The two curves refer to OSLOM (diamonds) and Infomap
(circles).

