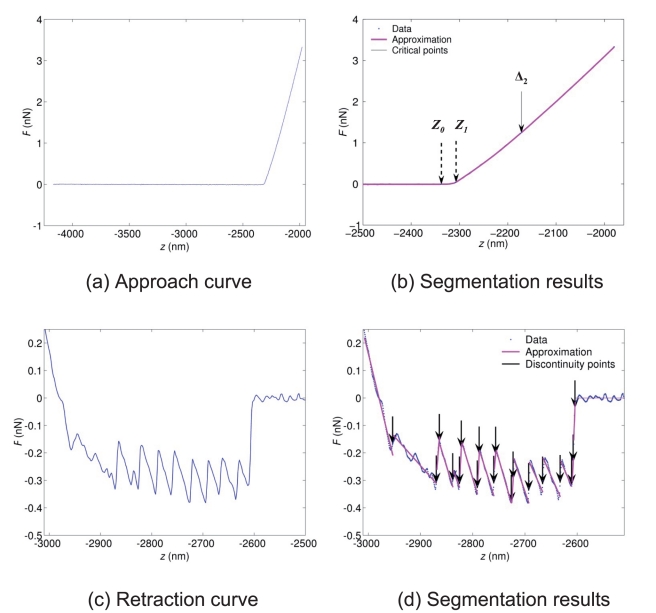
Figure 2. Force curve segmentation.
The approach and retraction curves correspond to the marked pixel in the E. coli cell image shown in Figure 4c. (a) Approach curve: experimental data. The curve is preprocessed by subtraction of an affine baseline. (b) Segmentation results with 6 discontinuity points. In the interval z ∈ [−2500, −2000] nm, only three discontinuity points are present. Both points represented with dashed arrows are the edges  and
and  of the electrostatic region. The next discontinuity point (
 nm) marked by a plain arrow is used as initial estimation of the transition between Hertz and Hooke regimes. (c–d) Retraction curve. The polynomial degree is set to
  leading to a piecewise affine approximation of the original signal. The threshold value
  for the mean squared error is set to the empirical noise variance, and 20 discontinuities at most are detected. For the displayed retraction curve, 20 iterations were performed leading to 20 discontinuities.

